Visualizing the Network |
|

I researched and evaluated the following three network monitoring and visualization tools:
|
Wireshark
|

ntopng
|

Cacti Netflow
|
|
Solution |
Overview |
Pro’s |
Con’s |
|
Wireshark |
Wireshark is a free and open source
packet analyzer. It is used for network troubleshooting, analysis, software
and communications protocol development, and education. Google search yields
11M results. |
· Very well known, large install-base · Pre-installed with Kali Linux · Millions of instructional videos available on-line |
· Notifications do not make it known if there’s an
intrusion · Can only collect info from a network, not send |
|
ntopng (next-gen ntop) |
ntopng is the next generation version
of the original ntop, a network traffic probe that monitors network
usage. ntopng is based on libpcap and it has been written in a portable way
in order to virtually run on every Unix platform, MacOS and on
Windows as well. |
· UI updated to HTML 5; excellent graphics · Complete rewrite over its predecessor – ntop · Real-time flows |
· Very involved installation process |
|
Cacti |
Cacti is an open-source, web-based
network monitoring and graphing tool designed as a front-end application for
the open-source, industry-standard data logging tool RRDtool. Google search
returns 1.2M results (“Cacti Software”). |
· Graphical UI; graphs can toggle between list view and
preview mode · Use of templates; allows more convenience for
graphing data sources |
· Extremely involved installation process with many
dependencies · Does not support SNMP · Small user community · Does not support RDBMS for storing information |
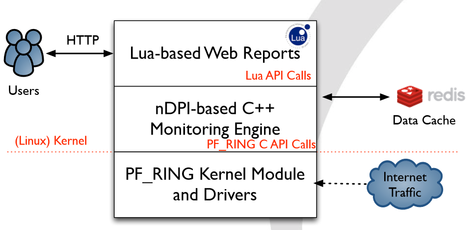
Ntopng addressed many of limitations of ntop through a complete re-write of the code, new UI standards (HTML 5) and real-time processing of traffic. One of the main improvements was to the architecture. Ntopng moved from a monolith, closed architecture to three different and self-contained components, communicating with clean API calls. See Figure 2 below (Deri, 2015).
Cacti is a tool with great graphics, however, I immediately disqualified it due to the risk and hassle to install it on my working CentOS environment. Quite simply, I “chickened-out”. I had everything working perfectly in my lab environment with Wireshark and ntopng monitoring traffic on all three nodes. In addition to the concerns regarding the immediate installation requirements, it lacked some features that I suspected I may need like SNMP monitoring and the ability to interrogate the data directly against an RDBMS system. Therefore, I put this on pause for the near-term and will consider revisiting in the future as it does appear to be a viable solution.
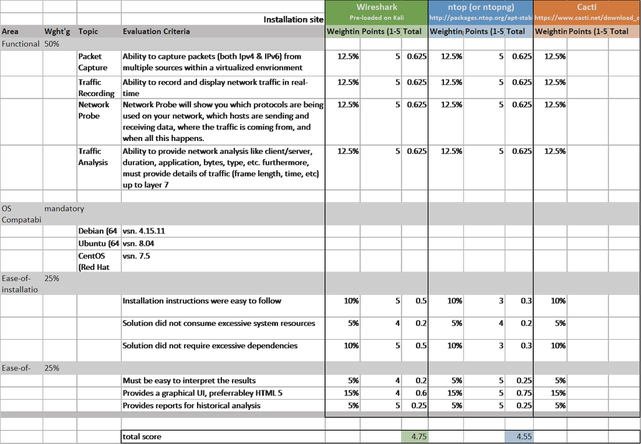
The approach I took to this assignment was that of a request for proposal (RFP). I did this to ensure an objective analysis of the different packages against a pre-determined set of requirements. Each requirement has a relative weight of importance and received a score from 1 to 5 based on my evaluation of the tool across the following four areas; functionality, OS compatibility, ease-of-installation and finally, ease-of-use. The weighting is important because I needed to make sure the areas of installation and user interface were well represented given the short time-period of this assignment and course. Therefore, I placed a significant weight on the above two factors. However, in a production environment these factors would likely not receive as high of a weight and more weight would be allocated to functionality.
Table 3 below is the RFP that I designed to evaluate the three tools. I did not install Cacti and therefore, it does not have a score. Although Wireshark achieved a slightly higher overall score in this evaluation criteria (4.75 vs 4.55), I decided to pursue ntopng for the remainder of the assignment. Primarily due to the fact I invested a fair amount of time to install it and it appeared to have a rich UI to assist in my overall understanding of the tool and concepts.
Let's say a heartbeat message with a payload_length of 65535, ie: a heartbeat with a 64KB payload, the maximum possible, is received. The code has to send back a copy of the incoming HeartbeatMessage, so it allocates a buffer big enough to hold the 64KB payload plus one byte to store the message type, two bytes to store the payload length, and some padding bytes, as per the above structure. It constructs the reply HeartbeatMessage structure with the following code, where bp is a pointer to the start of the reply HeartbeatMessage:
I needed to first check the compatibility of the OS versions in my VM to make sure the tools would be compatible. I did this with the following commands (see Appendix A – Lab Notes), summarized in the table below.
|
VM Node |
OS |
OS Version |
Command used (Terminal) |
|
Kali Linux |
Debian (64
bit) |
4.15.11 |
uname -a |
|
Metasploit |
Ubuntu (64
bit) |
8.04 |
lsb_release -a |
|
WebGoat |
CentOS (Red
Hat (64 bit)) |
7.5 |
cat
/etc/*release* |
|
Step
# |
Description |
Commands |
|
|
Installing
ntopng |
|
|
1 |
Add the EPEL repository to my system |
sudo yum
install epel-release |
|
2 |
create a ntop repository for the stable
builds |
sudo nano
/etc/yum.repos.d/ntop.repo |
|
3 |
Add the following content to the ntop.repo file |
[ntop] name=ntop
packages baseurl=http://www.nmon.net/centos-stable/$releasever/$basearch/
enabled=1 gpgcheck=1 gpgkey=http://www.nmon.net/centos-stable/RPM-GPG-KEY-deri
[ntop-noarch]
name=ntop
packages baseurl=http://www.nmon.net/centos-stable/$releasever/noarch/
enabled=1 gpgcheck=1 gpgkey=http://www.nmon.net/centos-stable/RPM-GPG-KEY-deri |
|
4 |
update the repositories and all
installed packages |
sudo yum -y
update |
|
5 |
install ntopng |
sudo yum
--enablerepo=epel install redis ntopng |
|
|
Start the
Ntopng and Redis Service |
|
|
6 |
install the hiredis-devel package and
start the redis server before starting ntopng |
sudo yum
--enablerepo=epel install hiredis-devel |
|
7 |
start the redis service and enable the
service to start at boot time |
sudo
systemctl start redis.service sudo
systemctl enable redis.service |
|
8 |
start ntopng and add the service to
start at boot time |
sudo
systemctl start ntopng.service sudo
systemctl enable ntopng.service |
|
|
Configure
Ntopng |
|
|
9 |
check the ntopng status |
sudo
systemctl status ntopng |
|
|
Allow
Ntopng Through the Firewall |
|
|
10 |
add firewall rule to access ntopng from
remote machine |
sudo
firewall-cmd --permanent --add-port=3000/tcp |
|
11 |
reload the fire-walled service |
sudo
firewall-cmd --reload |
|
|
Test
Ntopng |
|
|
12 |
go to the URL http://localhost:3000 |
admin/admin |
|
|
|
|
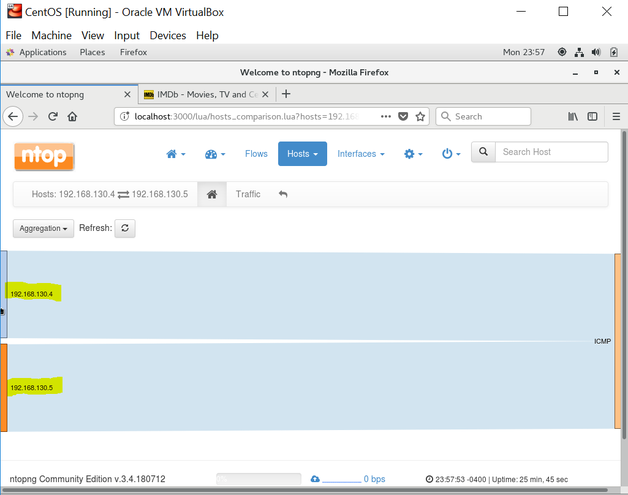
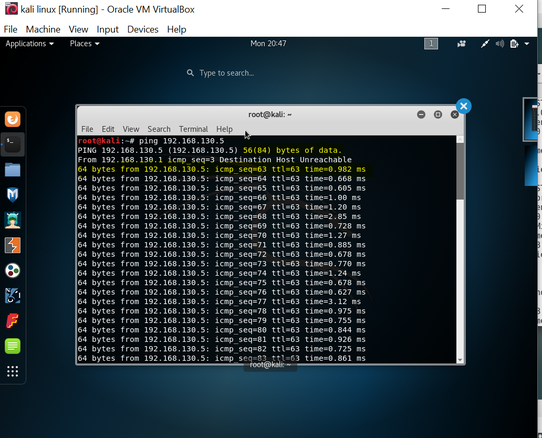
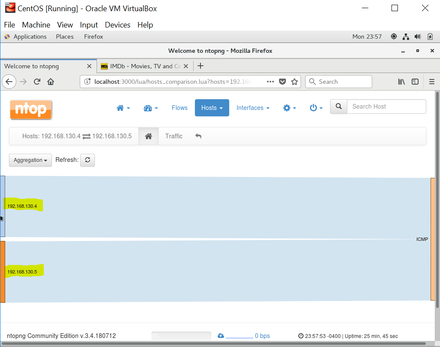
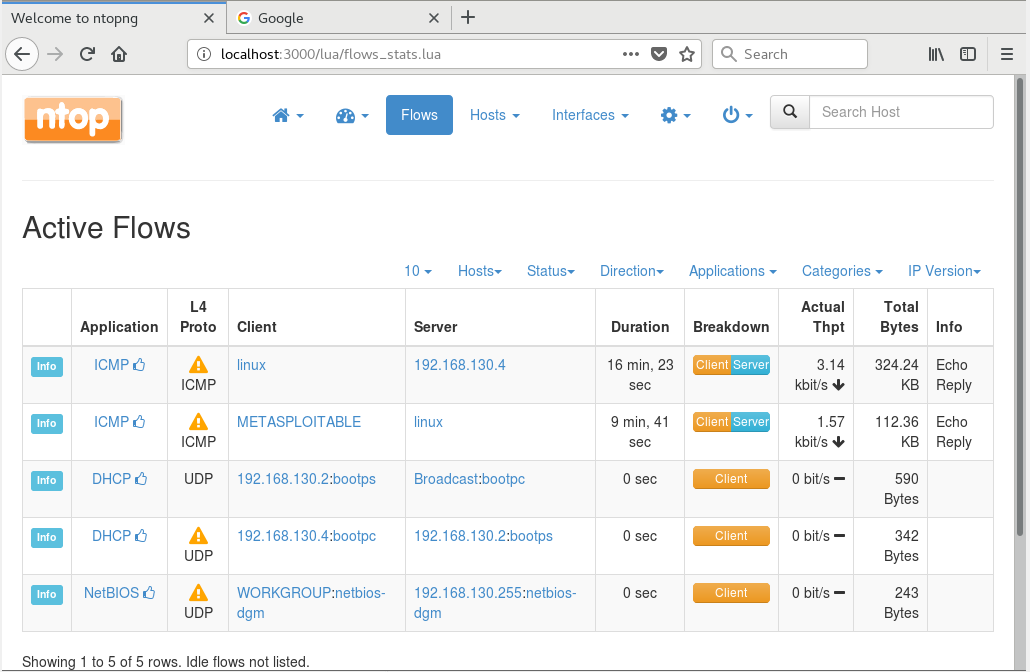
I simply opened each VM and used the ping command to hit each VM node. this command sent 56bytes of data to the CentOS node and received 64byte packet in return to acknowledge the communication. See figure 6. Figure 7 shows the view in ntopng. Additionally, both the Kali and the CentOS nodes have an additional network adapter assigned to them (NAT) to allow each to contact the internet. As a part of the experiment, I toggled between network adapters to view the network traffic.
|
|
Deri, L. (2015, June 22). SharkFest 2015. Retrieved July 23, 2018, from
https://sharkfestus.wireshark.org/assets/presentations15/16.pdf
Hitjethva. (2016, February 2). Install Ntopng Network Traffic Monitoring Tool on CentOS 7. Retrieved
July 22, 2018, from https://devops.profitbricks.com/tutorials/install-ntopng-network-traffic-monitoring-tool-on-centos-7/
Little, E., & Lindros, K. (2017, November). How to select the best network monitoring tool. Retrieved July
22, 2018, from https://searchnetworking.techtarget.com/feature/How-to-select-the-best-network-monitoring-tool
PsychzNetworks. (2018, February 25). Zabbix vs Nagios vs Cacti. Retrieved July 23, 2018, from
https://www.psychz.net/client/question/en/zabbix-vs-nagios-vs-cacti.html